STAT and ATP
STAT
Note
The tool may fail to work properly without loading the cray-cti
module. Until this is added automatically by the system, please
load the module, too.
STAT (the Stack Trace Analysis Tool) is a highly scalable, lightweight tool that gathers and merges stack traces from all of the processes of a parallel application. The results are then presented graphically as a call tree showing the location that each process is executing.
This is a useful tool for debugging an application that hangs because collected call backtraces can quickly tell you where each process is executing at the moment in the code, providing a hint on where to look further for more detailed analysis.
It supports distributed-memory parallel programming only such as MPI, Coarray Fortran and UPC (Unified Parallel C).
One way to collect backtraces under Slurm is explained below.
-
Start an interactive batch job and launch an application in background. Keep the process ID (PID).
$ salloc -N 1 -t 30:00 -q debug [...other flags...]
...
$ srun -n 4 [...other flags...] ./jacobi_mpi &
[1] 95298
You can also see the PID by running the
pscommand: -
Load the
cray-statmodule: -
Run the
stat-clcommand on this process. You may want to use the-iflag to gather source line numbers, too:$ stat-cl -i 95298 STAT started at 2016-11-30-07:33:37 Attaching to job launcher (null):95298 and launching tool daemons... Tool daemons launched and connected! Attaching to application... Attached! Application already paused... ignoring request to pause Sampling traces... Traces sampled! ... Resuming the application... Resumed! Merging traces... Traces merged! Detaching from application... Detached! Results written to /global/cscratch1/sd/elvis/parallel_jacobi/stat_results/jacobi_mpi.0004stat-cltakes several backtrace samples after attaching to the running processes. The result file is created in thestat_resultssubdirectory under the current working directory. This subdirectory contains another subdirectory whose name is based on your parallel application's executable name that contains the merged stack trace file in DOT format. -
Then, run the GUI command,
stat-view(orSTATview), with the file above to visualize the generated*.dotfiles for stack backtrace information.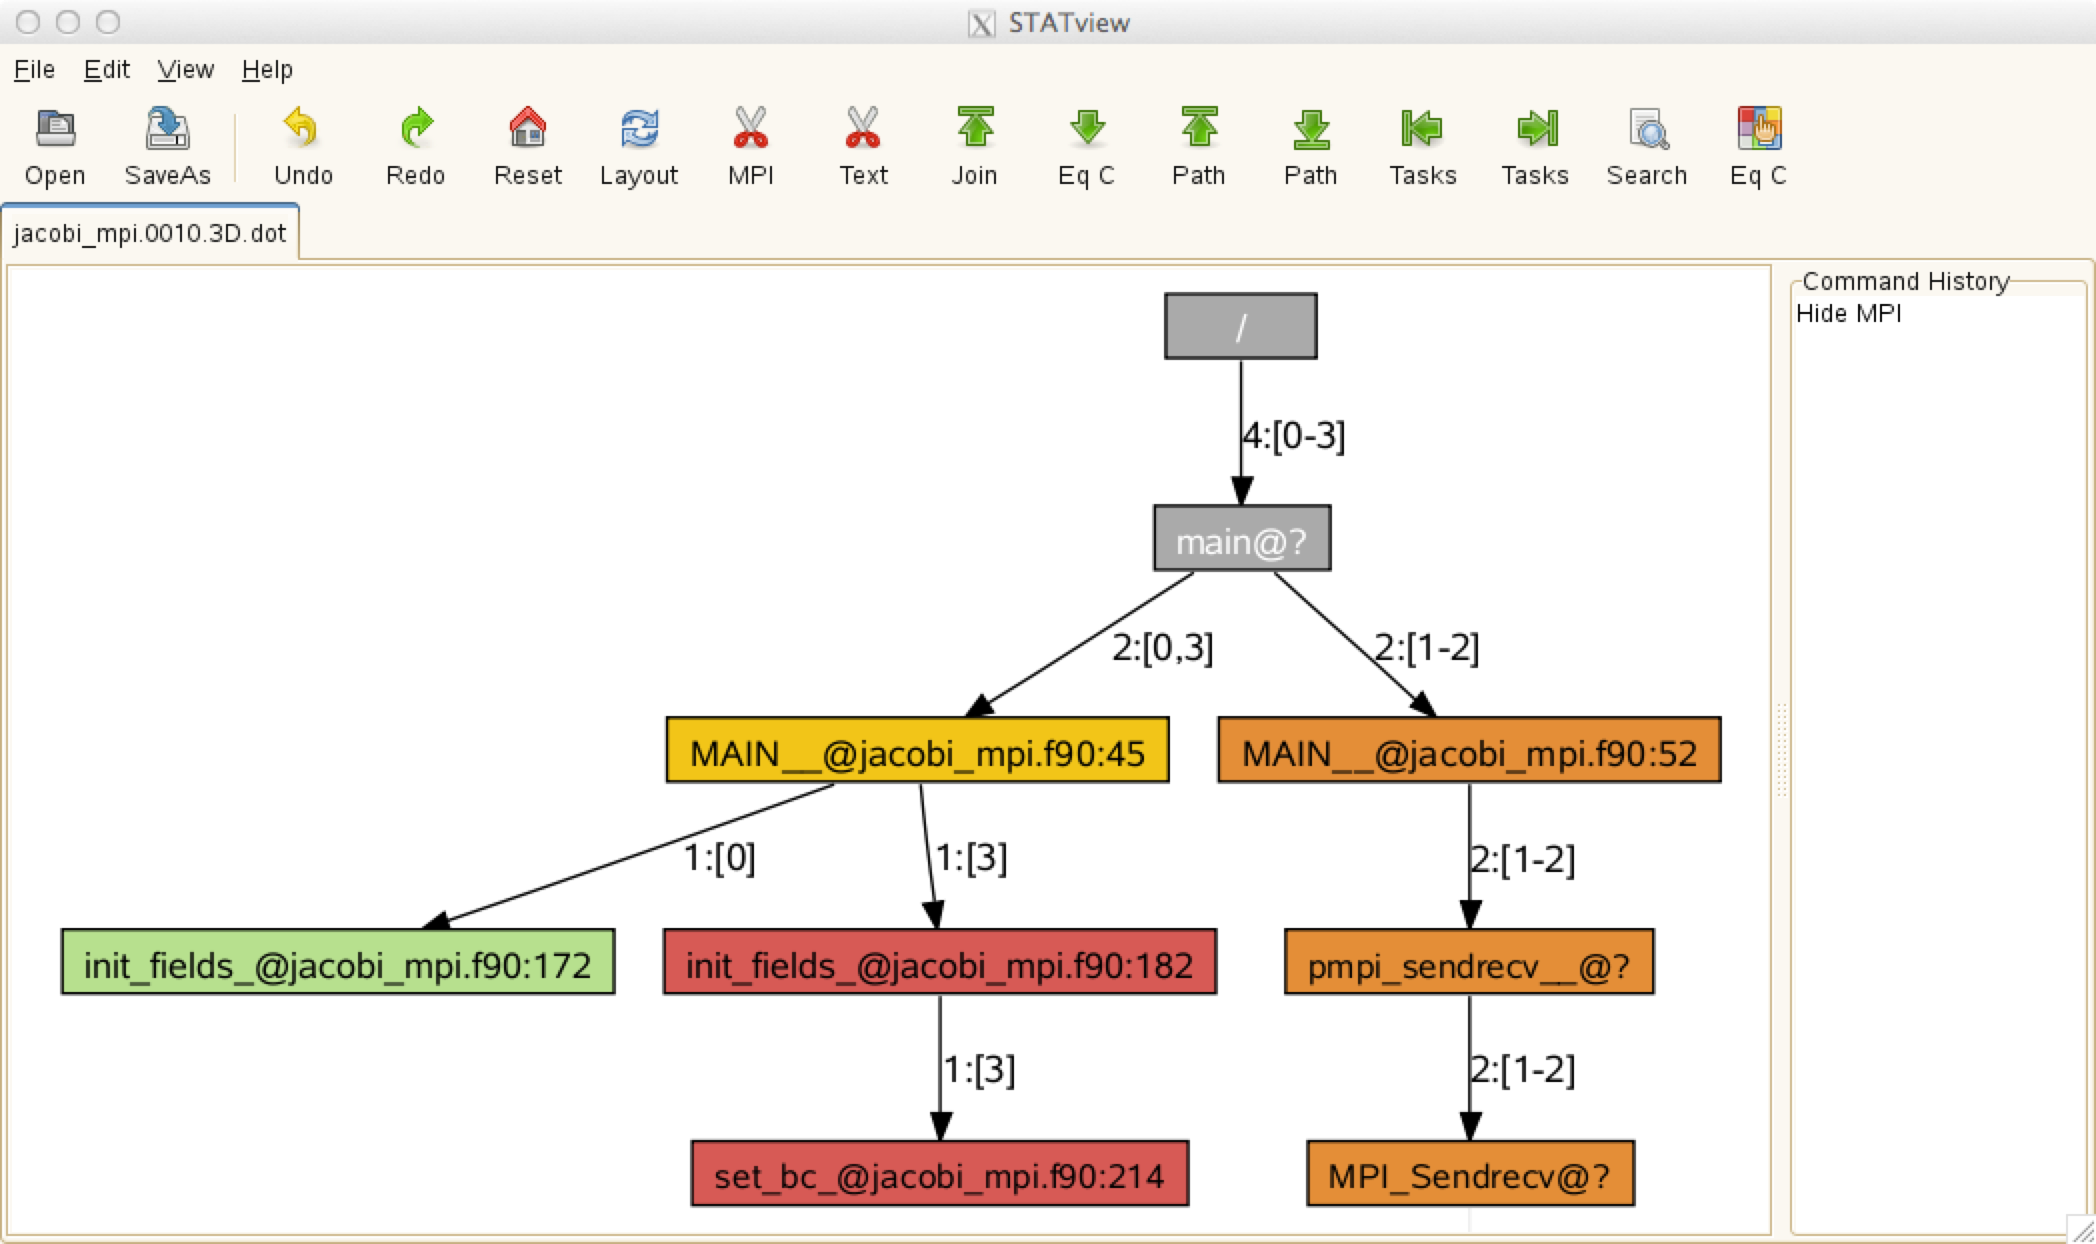
The above call tree diagram reveals that rank 0 is in the
init_fieldsroutine (line 172 ofjacobi_mpi.f90), rank 3 in theset_bcroutine (line 214 of the same source file), and the other ranks (1 and 2) are in theMPI_Sendrecvfunction. If this pattern persists, it means that the code hangs in these locations. With this information, you may want to use a full-fledged parallel debugger such as DDT or TotalView to find out why your code is stuck in these places.
ATP
Note
The tool may fail to work properly without loading the cray-cti
module. Until this is added automatically by the system, please
load the module, too.
Another useful tool in the same vein is ATP (Abnormal Termination Processing) that Cray has developed. ATP gathers stack backtraces when the code crashes, by running STAT before it exits.
Load the atp module. Ensure that the target application is built
with debug symbols (usually -g) after loading the module. Note
also that, when the module is loaded, applications built with the
Cray or GNU compilers are automatically linked against the ATP
signal handler.
To enable it at runtime so that it generates stack backtrace info
upon a failure, set the following environment variable before your
srun command in your batch script:
Intel Fortran and GNU Fortran have their own abnormal termination
handling enabled by default. If ATP processing is desired instead,
you need to set the FOR_IGNORE_EXCEPTIONS environment variable
if you're using Fortran and you have built with the Intel compiler:
setenv FOR_IGNORE_EXCEPTIONS true   # for csh/tcsh

export FOR_IGNORE_EXCEPTIONS=true   # for bash/sh/ksh
If your Fortran code is built with the GNU compiler, you will need to
link with the -fno-backtrace option.
When atp is loaded no core file will be generated. However, you
can get core dumps (core.atp.<apid>.<rank>) if you set coredumpsize
to unlimited:
Even if Linux core dumping is enabled, ATP-specific core dumping
can be disabled by setting the environment variable ATP_MAX_CORES
to 0.
More information can be found in the man page: type man intro_atp
or, simply, man atp.
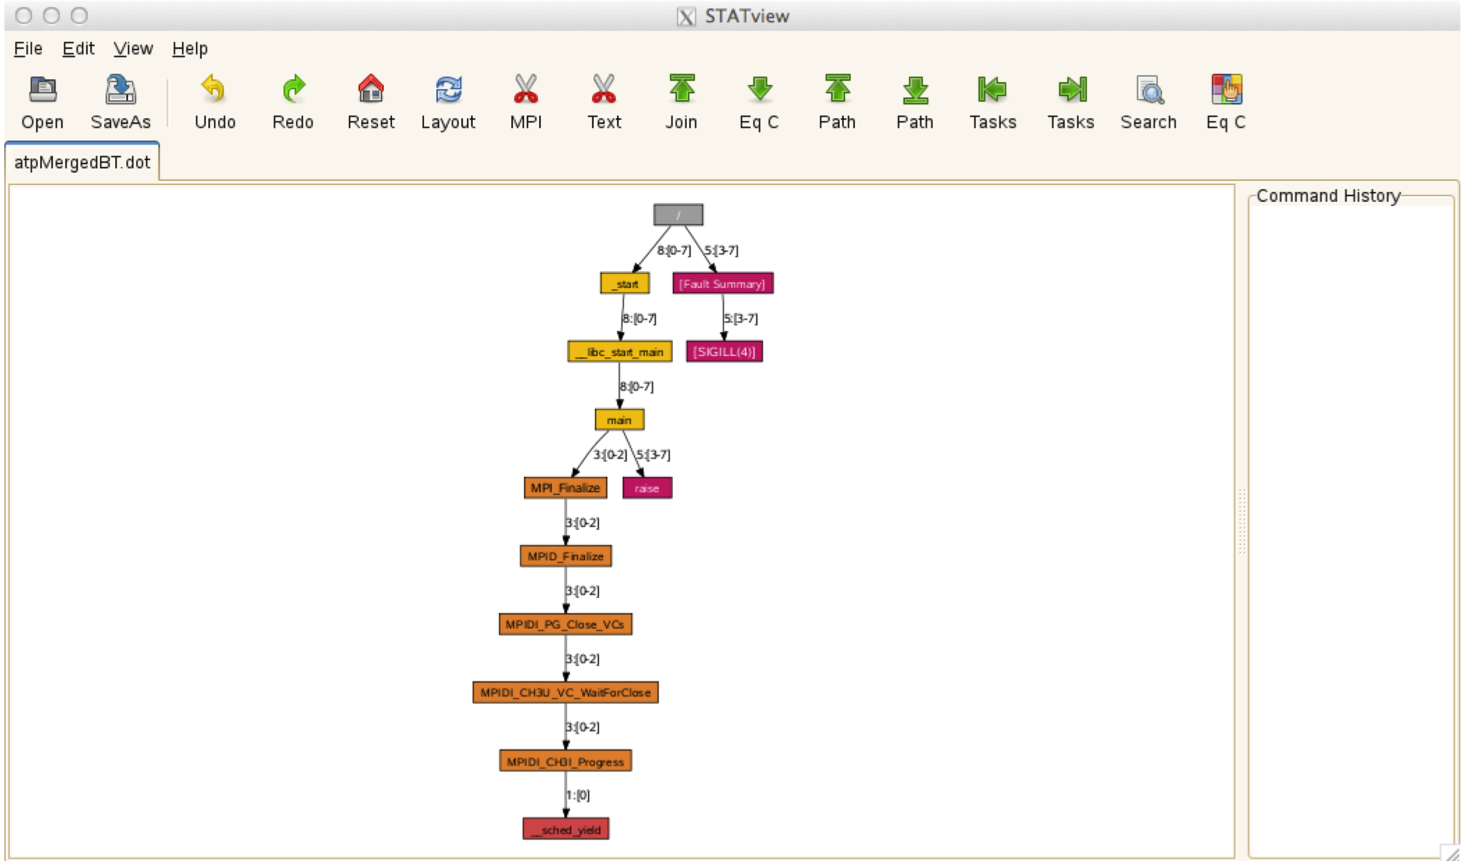
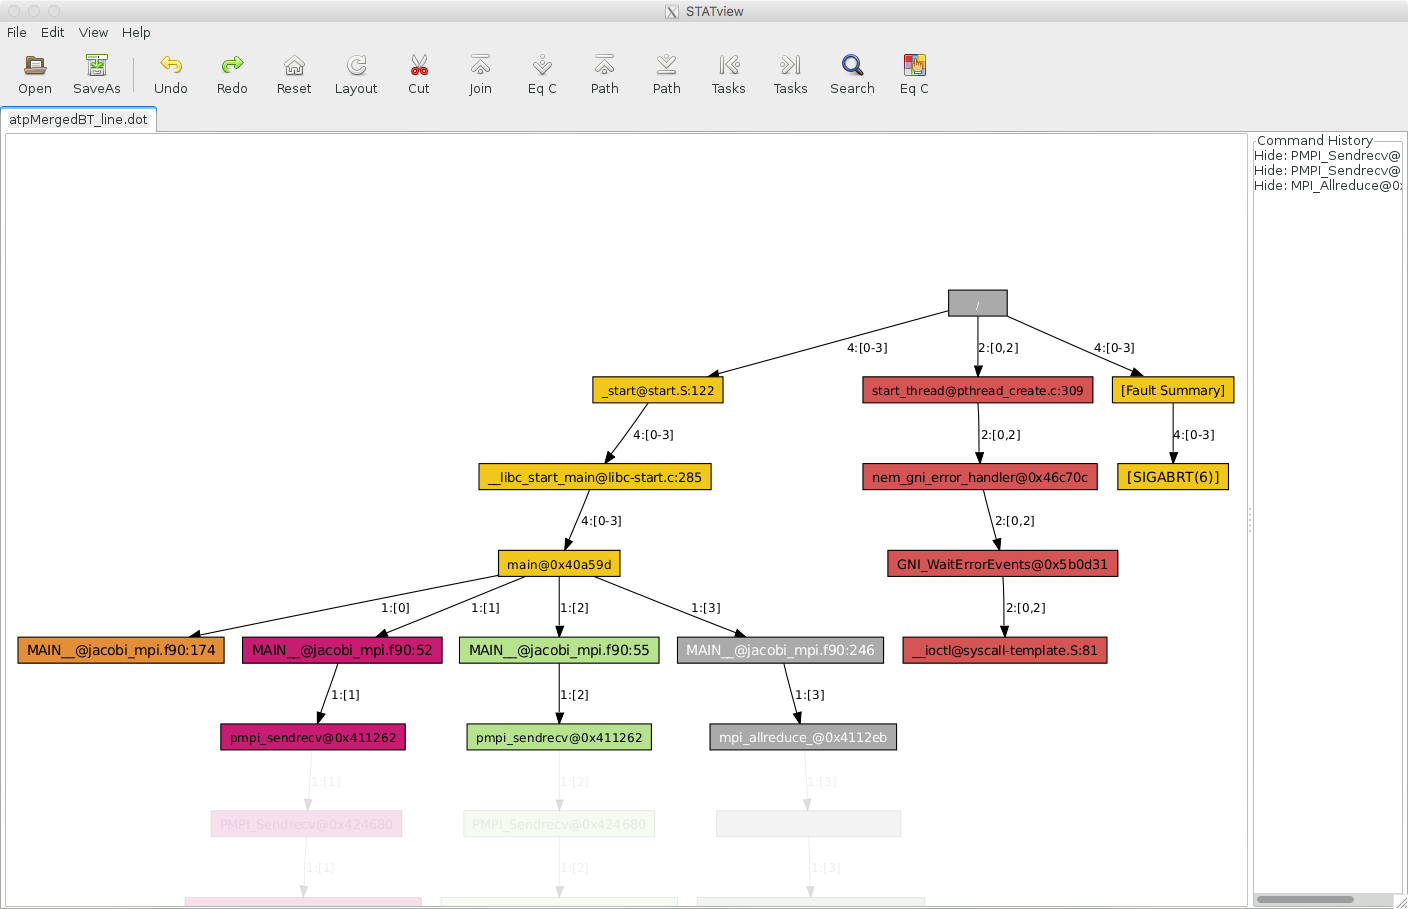
ATP creates a merged stack backtrace files in DOT fomat in
atpMergedBT.dot (with function-level aggregation) and
atpMergedBT_line.dot (with line-level aggregation). The latter
shows source line numbers. To view the collected backtrace result,
you need to load the cray-stat on Perlmutter, and run stat-view:
ATP can be a useful tool in debugging a hung application, too. You
can force ATP to generate backtraces for a hung application by
killing the application. To do that, you should have done necessary
preparatory work such as setting the ATP_ENABLED environment
variable, etc. in the batch script for the job in question.
$ sacct -j 3169879                # find job step id for the application - it's 3169879.0
       JobID    JobName  Partition    Account  AllocCPUS      State ExitCode
------------ ---------- ---------- ---------- ---------- ---------- --------
3169879           runit regular_m+      mpccc        544    RUNNING      0:0
3169879.ext+     extern                 mpccc        544    RUNNING      0:0
3169879.0    jacobi_mp+                 mpccc          4    RUNNING      0:0
3169879.1    cti_dlaun+                 mpccc          2    RUNNING      0:0


$ scancel -s ABRT 3169879.0       # Kill the application

$ cat slurm-3169879.out
Application 3169879 is crashing. ATP analysis proceeding...

ATP Stack walkback for Rank 0 starting:
  _start@start.S:122
  __libc_start_main@libc-start.c:285
  main@0x40a59d
  MAIN__@jacobi_mpi.f90:174
ATP Stack walkback for Rank 0 done
Process died with signal 6: 'Aborted'
View application merged backtrace tree with: STATview atpMergedBT.dot
You may need to: module load stat
[snip]

$ stat-view atpMergedBT_line.dot
The above example is to use SIGABRT in killing the application.
There are other signals accepted by ATP. For info, please read the
atp man page.
If you cannot run your application interactively because your job
requests a large number of nodes or it takes a long time to reach
a problematic area, the above interactive approach is not practical.
In that case, you can submit a non-interactive batch job where a
signal is sent just before the job is supposed to end, and a signal
handler cancels the application. The following example job script
is to send the SIGUSR1 signal (a user-defined signal) 300 seconds
before the job ends (#SBATCH --signal=B:USR1@300) -- this is when
the application is presumed hung. The job runs a trap command
which then sets the canceL_srun function to be invoked upon
catching the signal. The function then cancels the application,
triggering ATP to generate debug info. Note that, in this example,
the srun process is canceled with the Slurm job step ID,
${SLURM_JOB_ID}.0, for the first srun ("0") of the job. If you
have multiple srun's in a job script and you want to target a
certain job step, the proper step ID should be used.
#!/bin/bash
#SBATCH -A <allocation_account>
#SBATCH -N 2
#SBATCH -C cpu
#SBATCH -t 30
#SBATCH -q regular
#SBATCH --signal=B:USR1@300

 module load cray-cti
 module load atp
 export ATP_ENABLED=1
 export FOR_IGNORE_EXCEPTIONS=true   # Fortran code built with the Intel compiler

 cancel_srun() {
   echo SLURM_JOB_ID = $SLURM_JOB_ID
   scancel -s ABRT ${SLURM_JOB_ID}.0
 }

 srun -n 8 --cpu-bind=cores ./jacobi_mpi &

 trap cancel_srun SIGUSR1

 wait